Contact Us
© All rights reserved. 2024
Subscribe to our monthly newsletter for the latest insights, commentary and strategy results.
Subscribe to Our NewsletterAs I have written in the past, predicting stock market returns is largely an exercise in futility. Over the past several decades, the forecasted returns for the S&P 500 Index provided by Wall Street analysts have been slightly less accurate than someone who would have merely predicted each year that stocks would deliver their long-term average return. Importantly, not one major Wall St. strategist predicted either the tech wreck of the early 2000s or the global financial crisis of 2008-9.
To be clear, I am still adamant that consistently accurate forecasts are beyond the reach of mere mortals (or even quant geeks like me). Any investor who could achieve this feat would reap returns that put Buffett’s to shame. However, there may be some hope on the horizon. Good is not the enemy of great. The objective of any investment process should not be perfection, but rather to make its adherents better off than they would be in its absence.
To this end, I have decided to sin a little and model some of the most commonly cited macroeconomic variables that influence stocks market returns, with the objective of (1) ascertaining whether and how these factors have historically influenced markets and (2) what these variables are signaling for the future.
Don’t Fight the Fed
It is often stated that one shouldn’t fight the Fed. Historically, there has been an inverse relationship between changes in Fed policy and stock prices. All else being equal, increases in the Fed Funds rate have been a headwind for stocks while rate cuts have provided a tailwind.
Prior 1-Year Change in Fed Funds Rate vs. 1-Year Real Returns: S&P 500 Index (1960-Present)
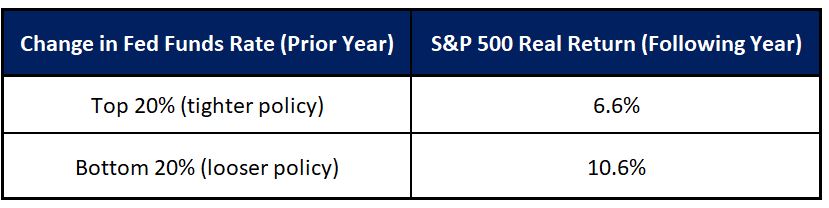
As the preceding table illustrates, the difference in one-year real returns following instances when the Fed has been pursuing tighter monetary conditions has on average been 6.6%, as compared to 10.6% following periods when it has been in stimulus mode.
As of the end of June, the Fed increased its policy rate by 3.5% over the past 12 months. From a historical perspective, this change in stance lies within the top 5% of one-year policy moves since 1960 and is the single largest 12-month increase since the early 1980s. Given the historical tendency for stocks to struggle following such developments, this dramatic increase in rates is cause for concern.
Valuation, Voting, and Weighing
Over the past several decades, valuations have exhibited an inverse relationship to future equity market returns. Below-average P/E ratios have generally preceded above-average returns for stocks, while lofty P/E ratios have on average foreshadowed either below-average returns or outright losses.
Trailing P/E Ratio vs. 1-Year Real Returns: S&P 500 Index (1960-Present)
Since 1960, when P/E ratios stood in the bottom quintile of their historical range, the S&P 500 produced an average real return over the next 12 months of 9.4% compared with only 6.9% when valuations stood in the highest quintile. Sky high multiples have proven particularly poisonous, as indicated by the crushing bear market which followed the record valuations at the beginning of 2000.
To be clear, valuations have little bearing on the performance of stocks over the short term. However, their ability to predict returns over longer holding periods has been more pronounced. As Buffett stated, “In the short run, the market is a voting machine but in the long run, it is a weighing machine.”
Although valuations are currently nowhere near the nosebleed levels of the tech bubble of the late 1990s, they are nonetheless elevated. With a trailing P/E ratio hovering north of 21, the S&P 500’s valuation currently stands in the 84th percentile of all observations going back to 1960 and is at the very least not a ringing endorsement for strong equity market returns.
From TINA To TARA To TIAGA
At any given point in time, stock market valuations must be considered in the context of the yields offered by high quality money market instruments and bonds. The difference between the earnings yield on stocks and interest rates has historically been positively correlated to future market returns.
Earnings Yields Minus Fed Funds Rate vs. 1-Year Real Returns: S&P 500 Index (1960-Present)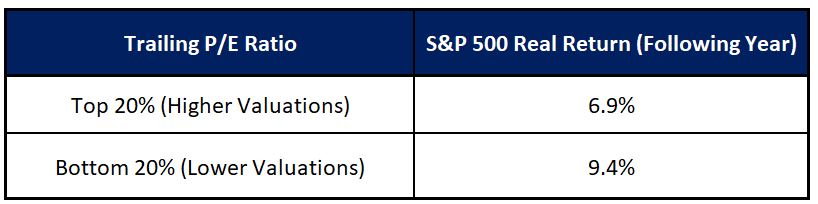
When the difference between earnings yields and the Fed Funds rate has stood in the top quintile of its historical range, the real return of the S&P 500 Index over the ensuing 12 months has averaged 8.7% versus only 2.2% following times when it has stood in the bottom quintile.
Until the Fed began to aggressively raise rates in early 2022, TINA (there is no alternative) was an oft-cited reason for overweighting stocks within portfolios. Yields on bank deposits and high-quality bonds yielded little to nothing, thereby spurring investors to reach out the risk curve and increase their equity allocations.
As the Fed continued to raise rates, increasingly higher yields made money markets and bonds look at least somewhat attractive for the first time in years, thereby causing market psychology to shift from TINA to TARA (there are reasonable alternatives).
The combination of elevated valuations and further tightening by the Fed has caused the earnings yield of the S&P 500 to fall below the Fed Funds rate, pushing market psychology from TARA to TIAGA (there is a good alternative). This dynamic is rare by historical standards, occurring only a handful of times since 1960. The last two instances when short-term rates exceeded the earnings yield on the S&P 500 occurred in 2007 and the late 1990s, both of which were followed by bear markets. Alternately stated, money market and bond yields constitute a potentially formidable foe for stocks. As one market pundit recently stated, “You can get a 5% yield by investing in U.S. T-bills with no risk. Hello equities? Are you listening?”
Fear of Inversion
Last but not least, the slope of the yield curve has historically been prescient with respect to future stock prices. Instances when longer term rates have exceeded their shorter-term counterparts by larger than average amounts have generally been followed by above-average returns for stocks, and vice versa.
10-Year Treasury Yield Minus Fed Funds Rate vs. 1-Year Real Returns: S&P 500 Index (1960-Present)
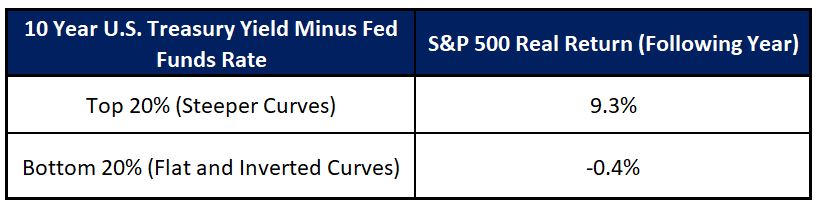
When the difference between 10-year U.S. Treasury yields and the Fed Funds rate has fallen within the top quintile of the historical distribution (steeper yield curves), the S&P 500 has on average produced a real return over the subsequent 12 months of 9.3%. This contrasts with an average of -0.4% following when this spread has stood in the bottom quintile (flat or inverted curves).
Inverted yield curves in which longer term yields lie below short term yields have proven particularly ominous. Inverted yield curves have predicted every recession since 1955, with only one false signal. During times when 10-year Treasury yields were lower than the Fed Funds rate, returns over the subsequent 12 months averaged only 2.8% as compared to 8.3% when the opposite was true.
With the Fed Funds rate currently exceeding the yield on the 10-year U.S. Treasury Bond by over 100 basis points, short-term rates currently exceed their longer-term counterparts by one of the largest amounts in history. Given the strong historical connection between inverted curves and subsequent recessions, it follows that there is a distinct possibility of a recession occurring in the near term. Moreover, above average valuations imply that equities are not materially discounting an economic contraction and an associated decline in company earnings.
People Are Strange. So Are Markets.
The combination of (1) a Fed Funds rate that has risen dramatically, (2) elevated valuations, (3) low earnings yields relative to current interest rates, and (4) a highly inverted yield curve is at the very least not a ringing endorsement for being overweight equities.
In 1976, the Doors released their famous album “Strange Days”, which contained Jim Morrison’s haunting vocal performance in the song “People Are Strange”. With all due respect to Mr. Morrison, stocks are at least as strange as people (or perhaps stocks are strange because the people who influence them are strange).
Momentum can take on a life of its own, even in the face of deteriorating fundamentals. Renowned investor Jeremy Grantham recalled that “In late 1997, as the S&P 500 passed its previous 1929 peak of 21x earnings, we rapidly sold down our discretionary U.S. equity positions then watched in horror as the market went to 35x on rising earnings. We lost half our Asset Allocation book of business but in the ensuing decline we much more than made up our losses.”
There are no flawless, silver bullet indicators for stocks, which means I am not suggesting that investors should run for the hills based on the preceding analysis. Although the macroeconomic indicators discussed in this missive represent some of the more powerful historical drivers of stock prices, the fact remains that there are thousands of variables and millions of interactions that have and can influence markets.
There have been a number of times when equities have performed admirably for several quarters in the face of rising rates, elevated valuations, low earnings yields relative to yields on high-quality bonds, and inverted yield curves. This being said, if the past proves to be prologue the odds argue for tepid returns from their stock portfolios over the near to medium term, and that investors may want to resist the temptation to add exposure and chase 2023’s rebound in stocks.
Playing It Safe
The Outcome Canadian Equity Income Fund has a strong history of preserving capital in challenging markets. The fund experienced considerably shallower losses than the TSX Composite Index during both the fourth quarter of 2018 and the Covid crash of early 2020 and managed to deliver a positive return in 2022. This relatively low downside capture allowed the fund to outperform the TSX Composite Index by 13.4% since its inception nearly five years ago. At the end of June, the portfolio’s already low market sensitivity was further reduced, leaving the fund well-positioned to outperform in the event of a decline in markets.