Contact Us
© All rights reserved. 2024
Subscribe to our monthly newsletter for the latest insights, commentary and strategy results.
Subscribe to Our NewsletterValuation: Good For Long But Not For Short
As I have written in the past, valuations are of no use for determining broad market returns over the short term.
To be clear, I am NOT implying that valuation doesn’t matter. Historical experience demonstrates that it has been an extremely powerful predictor of average returns over the long term. Without fail, whenever valuations have stood well below average levels, strong returns ensued over the next 7-10 years. Conversely, highly elevated valuations have preceded anemic or negative returns.
For investors interested in shorter-term market movements, sentiment indicators may harbor greater potential than their macroeconomic or valuation-based counterparts. In this month’s missive, I explore some of the more commonly cited indicators that purportedly possess short-term predictive capabilities to ascertain:
(1) Whether the historical record confirms the presence of any predictive power, and
(2) What these variables are signaling for markets in the near term.
The VIX Index: Embrace The Fear
The VIX Index represents the market’s expectations of the S&P 500 Index’s volatility over the next 30 days. Its level is derived from the prices of S&P 500 options with near-term expiration dates. Dubbed the “fear index”, the VIX is often used to gauge market sentiment, and in particular the degree of fear among market participants.
Historically, the VIX has served as a good, if imperfect indicator of market turning points:
VIX Index Levels and S&P 500 Index Returns: 1997 - Present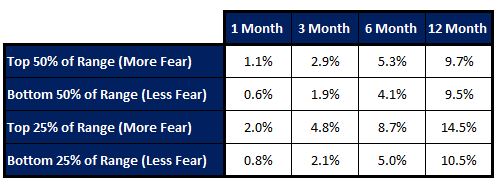
Putting specific bear markets and recoveries aside, the above table demonstrates that elevated VIX/fear levels have on average preceded higher returns, and depressed VIX/lower fear levels have foreshadowed lower returns. The historical record lends credence to Buffett’s sage advice that it is wise for investors to be “fearful when others are greedy, and greedy when others are fearful.”
Put Call Ratio: Beware Cheap Insurance
Like the VIX Index, the put-call ratio (PCR) is widely used to gauge the overall mood of the market. Put options provide the right to sell stocks at a predetermined price and are often purchased as insurance to protect portfolios from market declines. Call options offer the right to buy stocks at a predetermined price and are frequently bought to capture upside participation when stock prices rise.
The PCR increases when the market participants’ desire for downside protection rises relative to their desire for upside participation. Alternately stated, a rise in the PCR is indicative of a rise in bearish sentiment. Conversely, the PCR falls when people become more focused on reaping gains than on avoiding losses, which is indicative of a rise in bullish sentiment.
Since 1997, the PCR has been a contrarian indicator, whereby elevated levels (high fear/low greed) have on average signaled higher returns and lower PCRs (low fear/high greed) have heralded subdued or negative results.
Put-Call Ratio and S&P 500 Returns: 1997 - Present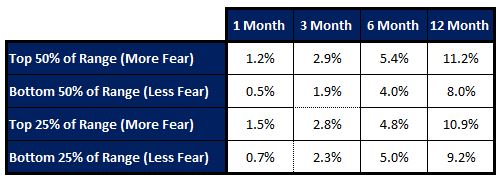
As demonstrated above, the S&P 500 Index has generally performed better following elevated PCR levels than after the PCR has stood below its historical average.
When People Tell You How They’re Feeling, Believe Them (Just Don’t Follow Them)
The American Association of Individual Investors (AAII) Sentiment Survey regularly asks investors where they think the market is heading in the next six months. When the percentage of bullish respondents far exceeds that of bearish ones, sentiment is deemed to be overwhelmingly positive, and vice versa.
The results of the survey have historically served as a contrarian indicator. High levels of pessimism have tended to precede strong returns, while high levels of optimism have tended to foreshadow challenging market environments.
The following table summarizes the efficacy of the three sentiment indicators in predicting past bear markets as well as subsequent rebounds (I have excluded the Covid crash and the subsequent rebound for obvious reasons). I define success as foreshadowing events within a sufficiently short timeframe such that investors could have added value by following the indicators’ signals.
Sentiment Indicators: Historical Success in Predicting Bear Markets & Subsequent Recoveries
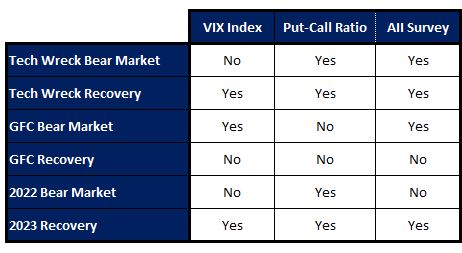
It goes without saying that there is no perfect market predictor, and the indicators which I have explored are no exception. Accordingly, they should be used with discretion and alongside other factors when evaluating what the future may have in store for markets. This having been said, all three sentiment indicators have done a better job than major Wall St. strategists, none of whom predicted any of the three bear markets, and who were by and large far too early or late with respect to their calls for subsequent recoveries.
Where We Currently Stand
As of the end of July, all three indicators were signaling significant but not extreme levels of investor bullishness and complacency. Both the VIX Index and the PCR stood within the bottom quartiles of their historical range, while the number of bulls relative to bears was higher than 75% of historical observations.
By no means does this imply that investors should run for the hills. Even in instances where the VIX Index and the PCR stood in the lower portion of their historical ranges and the AAII survey was indicating greater than normal levels of bullishness, markets on average rose over the next 1-12 months, albeit less so than when these indicators were signaling broad-based pessimism.
Nonetheless, the fact is that returns have historically been less robust when sentiment gauges have been at current levels. From a portfolio positioning standpoint, this implies that investors should at the margin lean more defensively. In addition, at times when stock prices are rising at a slower pace or declining, dividends comprise a far larger slice of the total return pie. Lastly, many blue-chip Canadian companies currently offer dividend yields that are not only higher than yields on high quality bonds, but are also taxed at a significantly lower rate.
Since its inception in October 2018, the Outcome Canadian Equity Income Fund has returned 57.0%, as compared to a gain of 49.0% for the TSX Composite Index and a gain of 44.1% for the TSX Dividend Aristocrats Index. Importantly, the fund has achieved this outperformance with lower volatility and shallower losses in declining markets.
Our Global Tactical Asset Allocation (GTAA) mandate has also exhibited strong defensive qualities, successfully protecting our clients from large losses during challenging markets, including late 2018, the Covid crash of early 2020, and more recently during last year’s bear market.