Contact Us
© All rights reserved. 2024
Subscribe to our monthly newsletter for the latest insights, commentary and strategy results.
Subscribe to Our NewsletterCrazy People is a 1990 American comedy starring Dudley Moore and Daryl Hannah. Moore plays advertising executive Emory Leeson. Leeson experiences a nervous breakdown which causes him to design a series of "truthful" advertisements that are blunt and bawdy.
By mistake, his ads get printed and turn out to be a tremendous success. One of Leeson’s more memorable campaigns is for Volvos, which includes the tagline "Volvo — they're boxy but they're good."
Dividend paying stocks are like the Volvos of the investing world. They are not fancy or exciting, nor do they produce windfall profits over the short term. However, they have a lot going for them when you take a deeper look under the hood.
This month, I explore the historical performance of dividend paying stocks, including the conditions under which they have tended to outperform their non-dividend paying counterparts. Relatedly I will also discuss whether the current market environment is supportive of future outperformance.
A Caveat to the Volvo Analogy: Having Your Cake and Eating It Too
The "Volvo — they're boxy but they're good" tagline implies a clear tradeoff – the suggestion being that one needs to sacrifice performance for reliability. However, the historical data imply that this has not been the case with dividend paying stocks. Not only have they exhibited greater stability than their non-dividend paying counterparts, but they have also produced higher returns, thereby providing investors with a “have your cake and eat it too” proposition.
S&P 500 Index vs. S&P 500 Dividend Aristocrats Index (1990 – Present)
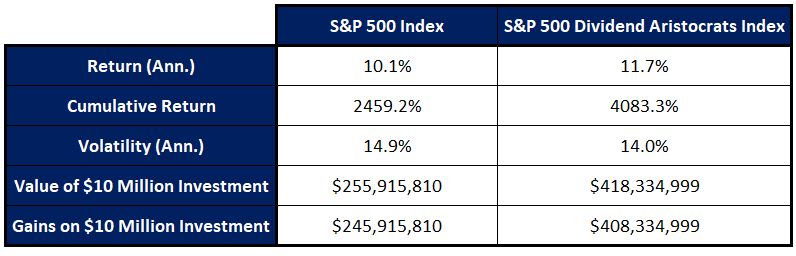
Since the beginning of 1990, the S&P 500 Index Dividend Aristocrats Index has produced an annualized total return of 11.7% vs. 10.1% for the S&P 500 Index. This difference in annualized performance has amounted to a tremendous difference in cumulative long-term returns, with the S&P 500 Dividend Aristocrats Index producing a cumulative return of 4,083% vs. a far less impressive 2,459% for the S&P 500 Index. In dollar terms, a $10 million investment in the S&P Dividend Aristocrats Index would have produced $408,334,999 in returns, which is 1.66 times more than the corresponding figure of $245,915,810 for the S&P 500 Index.
TSX Composite Index vs. TSX Dividend Aristocrats Index (2002 – Present)
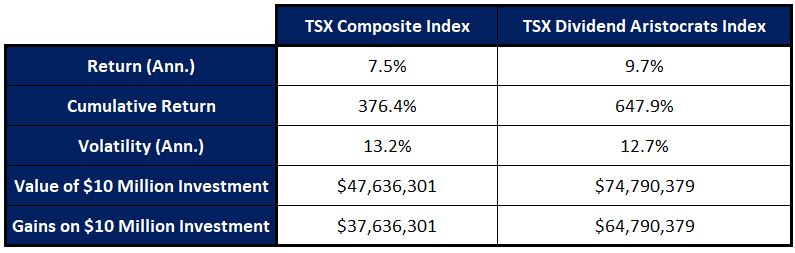
The numbers for Canada tell a similar story, albeit over a shorter period due to historical data limitations for the TSX Dividend Aristocrats Index. Since 2002, the TSX Dividend Aristocrats Index has produced an annualized total return of 9.7% vs. 7.5% for the TSX Composite Index. In terms of cumulative performance, the TSX Dividend Aristocrats has produced a total return of 647.9% vs. 376.4% for the TSX Composite Index. In dollar terms, a $10 million investment in the TSX Dividend Aristocrats Index would have produced $64,790,379 in returns, which is 1.72 times more than the corresponding figure of $37,636,301 for the TSX Composite Index.
As an aside, the tremendous difference from 1990 - present in the 2,459% cumulative return for the S&P 500 Index and that of 1,120% for the TSX Composite Index is largely attributable to the former’s far larger weighting in technology stocks. Between 1990 and 2010, the two markets were neck and neck, with the S&P 500 delivering a total return of 457% vs. 453% for the TSX. Since then, the S&P 500 went on to crush its northern neighbour, with a total return of 359% vs. 120%. During the same period, the mega-cap tech heavy Nasdaq 100 knocked the lights out, returning 675%.
Tech stocks, and in particular mega-caps, have experienced tremendous earnings growth and trade at premium valuations. Whether their rates of growth continue, or premium multiples will persist is beyond the scope of this commentary. That being said, there is no guarantee that these trends will persist, and relatedly whether the U.S. stocks will continue to outperform their Canadian counterparts.
Nice to Have in Strong Markets and Essential in Others
Dividends have historically been an integral part of equity market returns. Going back to 1990, a full 52.2% of the total return of the S&P 500 Index since 1990 can be attributed to the power of compounding reinvested dividends. On a relative basis, Canadian dividends have been even more prominent than U.S. ones, with reinvested dividends responsible for an astounding 63.3% of the total returns of the TSX Composite index.
Although dividends’ contributions to total market returns have been substantial over the past several decades, this contribution has tended to vary substantially over shorter sub-periods. As the table below demonstrates, dividends tend to play a smaller role in times of strong price appreciation. By contrast, during periods when capital gains have been muted, dividends play a far more substantial role in overall returns.
Contribution of Dividends to Total Returns: Rolling 12-Month Periods (1990 – Present)
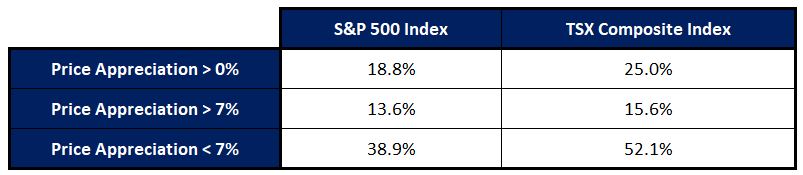
Taking all 12-month rolling periods since 1990 in which the S&P 500 experienced price appreciation, dividends on average accounted for 18.8% of total returns. However, in periods where prices rose by 7% or more, dividends were responsible for only 13.6% of the total return pie vs. 38.9% when prices rose between 0% and 7%.
In Canada, the relative importance of dividends has also varied with capital gains. In all rolling 12-month periods since 1990 in which the TSX Composite Index experienced price appreciation, dividends were on average responsible for 25% of total returns. In those periods where prices rose by more than 7%, dividends’ share of total returns was only 15.6% as compared to 52.1% when prices rose between 0% and 7%.
It goes without saying that when prices fall, dividends have been of paramount importance for the simple reason that they are the only things equity investors have going for them!
They’ll Be There for You When You Need Them Most
When non-dividend paying growth stocks deliver outsized gains, memories become short, and it becomes tempting to ignore the benefits of equity income. More recently, stupendous gains in the mega-cap “magnificent 7” growth stocks (Tesla, Apple, Nvidia, Amazon, Microsoft, Meta, and Alphabet) have dividend-paying stocks appear as quaint artifacts from an earlier time.
However, the fact remains that dividends constitute the most stable component of overall equity returns. A company’s dividend payout ratio (the percentage of earnings paid out as a dividend) is generally more stable than its share price. As a result, dividends are not subject to the same fluctuations as stock prices. Relatedly, dividend paying stocks tend to outperform in challenging market environments.
S&P 500 Index vs. S&P Index: Rolling 12-Month Periods (1990 – Present)
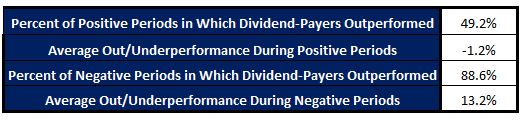
Out of all rolling 12-month periods since 1990, the S&P 500 Index has produced positive returns 82.2% of the time. During these up periods, the S&P 500 Dividend Aristocrats Index underperformed the S&P 500 Index by 1.2% on average. With respect to the remaining 17.8% of periods when the S&P 500 Index produced negative returns, the S&P 500 Dividend Aristocrats Index outperformed a full 88.6% of the time, with an impressive average outperformance of 13.2%.
TSX Composite Index vs. TSX Dividend Aristocrats Index: Rolling 12-Month Periods (2002 – Present)
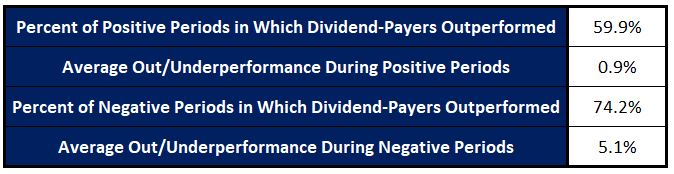
The TSX Composite Index has produced positive results in 75.1% of all rolling 12-month periods since 2001. During these instances, the TSX Dividend Aristocrats Index actually outperformed the TSX Composite Index 59.9% of the time, with an average outperformance of 0.9%. The relative performance of dividend paying stocks has been more impressive in declining markets, with the TSX Dividend Aristocrats outperforming 74.2% of the time by an average of 5.1%.
Where We Stand Today
Following the Global financial crisis of 2008, central banks the world over dropped rates to zero and then kept them below the level of inflation for the next 13 years. They also added fuel to the fire by adding additional liquidity through various non-conventional easing measures, including quantitative easing.
Although these measures were unprecedented, they nonetheless pale in comparison to the amounts of stimulus that were injected into the veins of the global economy in response to Covid. The one-two punch of fiscal stimulus and near-free money served as rocket fuel for the resulting multiple expansion and above average stock returns.
Today, central banks find themselves in a “once burned, twice shy” predicament. When inflation began to accelerate in 2021, the Fed failed to act, claiming that the problem was “transitory”. This miscalculation placed its credibility under increased scrutiny and has served as a stark reminder that highly stimulative policies can ignite inflation.
The upshot is that monetary authorities are unlikely to adopt the type of stimulative policies that characterized the 2009-2021 period any time soon. Rather, markets will likely need to adjust to a less friendly environment for the foreseeable future. This eventuality, combined with the specter of slowing growth and heightened volatility means investors should embrace the importance of dividends.
Creating Value Where It’s Hard to Find
Dividend-paying Canadian companies constitute the single largest investment category for Canadian investors. Aside from home equity bias, this can be attributed to the fact that Canadian dividends are taxed at a significantly lower rate than their foreign counterparts.
According to the most recent S&P Index Vs. Active Scorecard, 88.1% of Canadian dividend-focused equity managers have underperformed the TSX Dividend Aristocrats Index over the past five years. Against this backdrop, our algorithmically driven, machine learning-based approach has enabled the Outcome Canadian Equity Income mandate to add significant value for our clients. Since its inception, the fund has outperformed by 12.5% while simultaneously exhibiting lower volatility and shallower losses in challenging environments. On a risk-adjusted basis (Sharpe ratio), the fund has produced 1.61 times higher returns than the benchmark.