Contact Us
© All rights reserved. 2024
Subscribe to our monthly newsletter for the latest insights, commentary and strategy results.
Subscribe to Our NewsletterIn our discussions with clients over the past several months, the two frequent topics of conversation have been:
In the following missive, I use a data-based, historical approach to explore the possible investment implications of these concerns.
How Smart is the Yield Curve?
The U.S. Treasury market has an impressive track record in terms of forecasting recessions. Going back to the late 1980s, every time the yield on 10-year U.S. Treasury bonds has remained below that of its two-year counterpart for at least six months, a recession has followed. Such was the case with the recession of the early 1990s, of the early 2000s, and of the global financial crisis.
When it comes to investing (as with many things), timing is critical. Given that yield curves do occasionally invert and that recessions do happen from time to time, it follows that every recession has been preceded by an inverted curve, and vice-versa. What makes the historical prescience of inverted yield curves so impressive is that the recessions which followed them did so within a relatively short period.
United States - Months from Yield Curve Inversion to Onset of Recession: 1989-Present
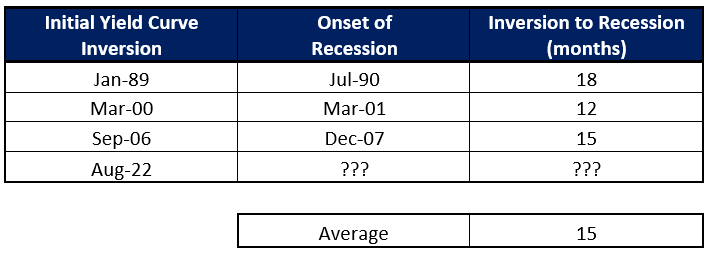
The table above covers the past three U.S. recessions, excluding the Covid-induced contraction of 2020, which I have omitted since it had nothing to do with macroeconomic factors, monetary policy, etc. As the table demonstrates, the time lag between yield curve inversions and economic contractions has ranged between 12 and 18 months, with an average of 15 months.
However, the yield curve’s impeccable record of predicting recessions has not been matched by its market timing abilities. As summarized in the following table, the S&P 500 Index has produced mixed results following past inversions in the Treasury curve.
S&P 500 Performance Following Yield Curve Inversions: 1989-Present
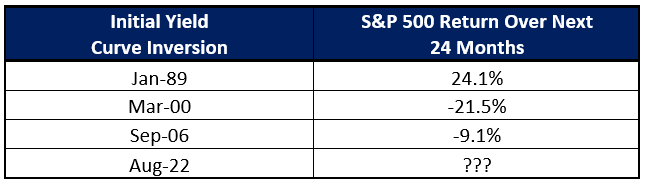
When the Treasury curve inverted at the beginning of 1989, stocks proceeded to perform well, returning 24.1% over the following two years. Conversely, when the curve became inverted in March 2000, the S&P 500 fared poorly, losing 21.5% over the same timeframe. The index suffered a similarly undesirable fate following the Treasury curve inversion in September 2006, when stocks suffered a two-year decline of 9.1%.
How Smart is the Stock Market?
In the past, the economy and equity markets have not been correlated. Stock prices are forward looking. Historically, equities have started to decline prior to peaks in economic growth and have tended to rebound in advance of economic recoveries.
The trillion-dollar question is not whether the market is smart, but whether it is smart enough. Do prices bake in a sufficient amount of bad news ahead of time so that they avoid further losses following the onset of recessions? Or do they lack sufficient pessimism to avoid this fate? Frustratingly, the answer depends on the recession!
S&P 500 Performance Following Start of Recessions: 1990-Present
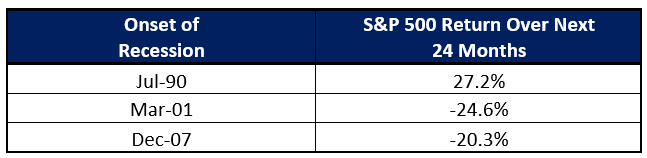
Stocks managed to skate through the recession of the early 1990s unscathed. Following the peak of the economy in mid-1990, the S&P 500 Index went on to produce a total return of 27.2% over the next two years. Unfortunately, investors were not so lucky during the recession of the early 2000s, with stocks losing 24.6% in the two years after the recession began. Similarly, the recession of 2008 was no walk in the park for markets, with the S&P 500 falling 20.3% after the economy began contracting at the end of 2007.
Valuation: The Quintessential Swing Factor
Unsurprisingly, the happy ending for stocks following the curve inversion of 1989 and the market declines following the inversions of early 2000 and late 2006 were preceded by very different equity market valuations.
S&P 500: CAPE Ratio During Yield Curve Inversions: 1989-Present
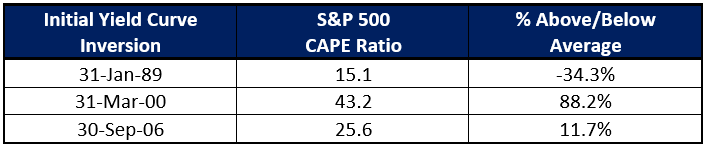
When the Treasury curve inverted in early 1989, the cyclically adjusted price-earnings (CAPE) ratio of the S&P 500 Index was 15.1, which is 34.3% below its average value of 23.0 since 1980. In contrast, when the curve inverted at the height of the dotcom frenzy in March 2000, the S&P 500 sported a nosebleed CAPE ratio of 43.2, which is an utterly batty 88.2% higher than its long-term average. While not nearly as demanding, stocks were also pricey when the curve inverted in late 2006 when the S&P 500 Index’s CAPE stood at an 11.7% premium to its long-term average.
As is the case with the stock market’s different reactions to yield curve inversions, its contrasting performance following the start of recessions can be delineated by its respective valuation starting points.
S&P 500: CAPE Ratio at the Onset of Recessions: 1990-Present
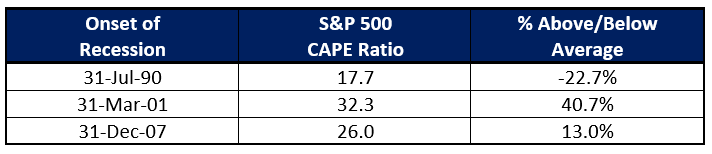
When the economy began to contract in the early 1990s, the S&P 500’s CAPE ratio was 17.7, which is 22.7% below its average level of 23.0 since 1980. This undemanding valuation provided a buffer which not only prevented stocks from suffering declines over the next few years but provided a backdrop whereby they managed to return 27.2% over the next two years.
On the other hand, the elevated valuations which accompanied the recessions of the early 2000s and 2008-2009 left little room for mercy when economic growth and corporate earnings faltered. When the economy began to roll over in early 2001, the CAPE ratio of the S&P 500 Index was 32.3, a full 40.7% above its long-term average. Stocks stood at a less enthusiastic but nonetheless elevated CAPE of 26.0 at the onset of the recession in late 2008 – a premium of 13.0% to its long-term average.
Where Things Currently Stand
As I have argued ad nauseum, macroeconomic forecasting is often an exercise in futility. Determining the odds of a recession occurring in the near-term is largely a waste of time, in my view. However, given the yield curve’s inverted state and its impressive record of foreshadowing such events, it follows that there is a decent chance of economic activity contracting at some point over the next few quarters.
As previously mentioned, starting point valuations have been the discerning factor with respect to how equities have performed following the onset of recessions. Given current valuations, equities are not particularly well-fortified should a recession occur. Although stocks are still well below peak prices reached at the beginning of 2022, the S&P 500’s current CAPE ratio of 30.4 remains 32.2% above its long-term average. Should a recession occur, markets are unlikely to emerge unscathed.
Hunkering Down and Rolling with the Punches
The algorithms behind our Global Tactical Asset Allocation (GTAA) strategy continue to signal caution, leaving the portfolio 100% invested in cash. These same signals have proven successful in protecting our clients from large losses during challenging markets, including late 2018, the Covid crash of early 2020, and more recently during the bear market of 2022. The machine-learning-based algorithms governing our Canadian Equity Income fund have proven robust through bull and bear markets, periods of subdued and high inflation, and some of the most violent swings in interest rates seen over the past 40 years. Since its inception in October 2018, the fund has returned 60.7%, as compared to a gain of 43.6% for the TSX Composite Index. Our recently-launched U.S. Equity Income mandate has also outperformed, declining 0.5% since its inception in April 2022, in comparison with a loss of 7.7% for the S&P 500 Index.