Contact Us
© All rights reserved. 2024
Subscribe to our monthly newsletter for the latest insights, commentary and strategy results.
Subscribe to Our NewsletterThe Rear-View Mirror: A Contrarian Indicator
As we have written before, sentiment and emotions can have an outsized influence on investor psychology and investment decisions. Relatedly, there is a powerful inclination among investors to perceive markets that have outperformed as being less risky than those that have underperformed.
Interestingly, this tendency exists not just among individual investors, but is also prevalent in the professional investment community. A 2008 study by finance Professors Amit Goyal and Sunil Wahal explored the performance of investment managers who had been fired by institutional investors. The analysis compared the managers’ performance in the three years before being fired with their subsequent three-year performance. The results of the study are summarized in the following graph.
The Selection and Termination of Investment Management Firms by Plan Sponsors
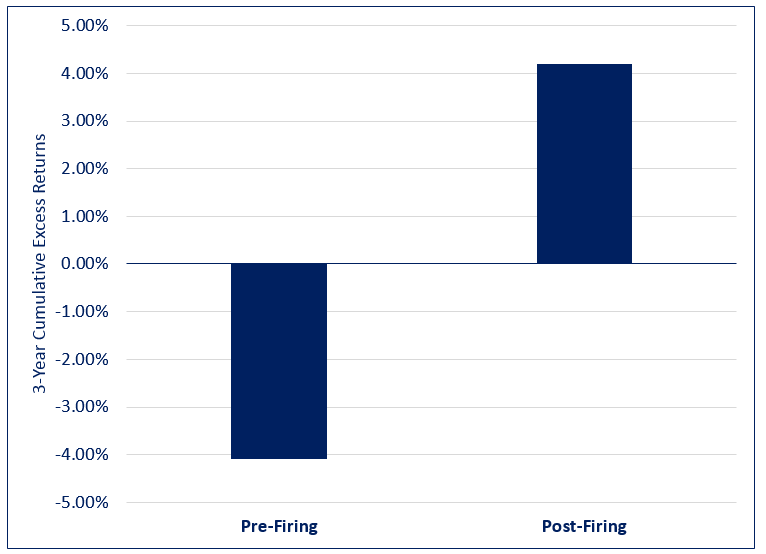
On average, fired managers had poor performance in the three years preceding their termination, with average annual underperformance of 4.1% vs. their benchmarks. This figure should come as no surprise, as you wouldn’t expect that they were fired for knocking the lights out! However, what may be counter-intuitive to many is that these managers tended to subsequently outperform, with average annual outperformance of 4.2% over the three years following their termination.
Clearly, not only does looking in the rear-view mirror fail to prevent you from hitting something that is in front of you but may in fact cause it!
The other takeaway is that even seasoned, institutional investors can be swayed by short-term performance, which in turn can lead to decisions which are both ill-timed and economically perverse.
Beware The Mean Reversion Boogeyman
Last year saw a continuation of a long-established trend of U.S. stock outperformance, with the S&P 500 rising 28.7% as compared to 8.3% for the MSCI All Country World Index (ACWI) Ex-U.S. From the end of 2008 through the end of last year, the S&P 500 rose at an annualized rate of 16.0%, producing a cumulative return of 587.3%. In comparison, the ACWI Ex-U.S. Index rose at an annual rate of 8.6% and delivered a cumulative return of 190.7%.
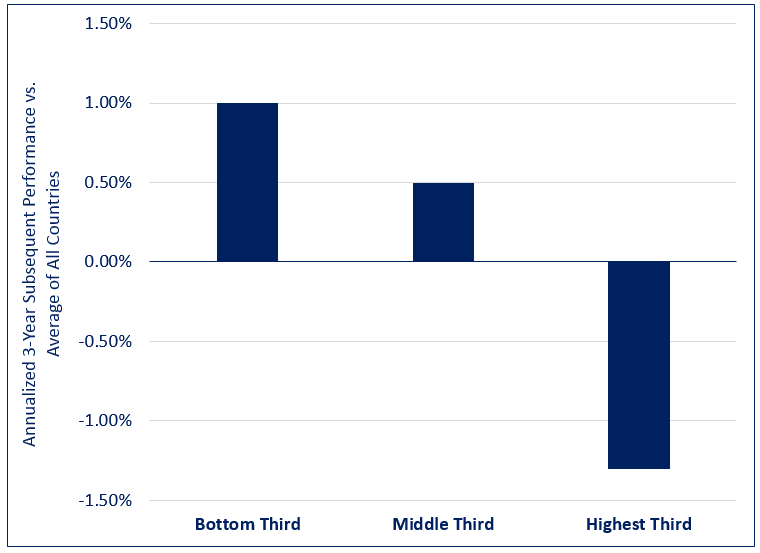
The outperformance of U.S. stocks argues for actively reducing U.S. exposure and increasing allocations to other regions, as the mean-reverting, contrarian nature of investment manager performance can also be applied at the country level. The following chart covers the period from 1970-2021 and includes the U.S., U.K., Germany, France, Australia, Japan, Hong Kong, and Canada. Specifically, it illustrates the results of investing every three years in a portfolio of country indexes based on their trailing returns over the previous three years.
3-Year Performance of Countries Ranked by Trailing 3-Year Performance
The chart brings fresh perspective to the standard regulatory disclosure language in the marketing materials of investment funds, which states that “Past performance is no guarantee of future returns.”
Outperforming countries tend to become subsequent underperformers – those that have had superior returns over the past three years tend to produce relatively poor results over the next three years. Conversely, underperformers tend to subsequently outperform – those that have lagged over the past three years tend to outperform over the next three years.
Investors who are content to simply stick with winners and refrain from reallocating away from U.S. stocks are taunting the ghosts of markets past at their own peril. In the words of famed philosopher George Santayana, “Those who cannot remember the past are condemned to repeat it.”
Navigating the Globe Using Valuation as a North Star
The pronounced and prolonged outperformance of U.S. stocks has led to an increased weighting of U.S. equities and a related decrease in non-U.S. equities in global stock indexes. These shifts have continued to the point where the valuation premium of the U.S. market to the rest of the world stands at its highest point in decades. This stark discrepancy is reflected in an extreme divergence between the market-cap weighted global stock index and its fundamentally weighted counterpart, in which stocks are weighted according to a composite measurement of their prices relative to sales, gross profits, and book values.
As of the end of last year, the cap-weighted global benchmark was 61% weighted in U.S. stocks, 26% weighted in non-U.S. developed markets, and 13% weighted in emerging regions. In contrast, the corresponding fundamentally based weights were 49%, 33%, and 18%. The differences in weightings between the two indexes are the largest in over 30 years. All else being equal, to revert to their fundamentally based weights, U.S. stocks would need to underperform by 38.5%, non-U.S. developed equities would need to outperform by 40.4%, and emerging region companies would need to outperform by 47% (yes, emerging stocks are enticingly cheap relative to the rest of the world).
Although relative valuations are of little use in forecasting relative performance over the short-term, they are useful for doing so over the medium to-longer term. A study by Mebane Faber of Cambria Investment Management covering the period 1980-2011 sorted countries by their cyclically adjusted price-earnings (CAPE) ratios on a yearly basis. It then compared the subsequent real returns of an equal weighted portfolio of the cheapest countries to one comprised of their most expensive counterparts. The results of the analysis are summarized in the following table.
Portfolios Sorted on CAPE Levels (1980-2011)
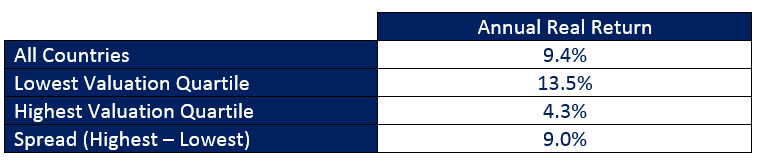
Taking the current regional valuation disparities in tandem with the historical tendency for attractively valued countries to outperform their more expensive counterparts, it’s an odds-on bet that U.S. stocks will lag those of most other countries for the foreseeable future.
FAAMG SHMAAMG
What if (dare we utter such ominous words) that “it’s different this time?”. To be fair, the U.S. equity market includes some outstanding companies. Specifically, given the phenomenal rates at which the heavily weighted FAAMG companies (Facebook, Apple, Amazon, Microsoft, and Google) have grown their profits, they do and should command premium multiples.
That being said, these champions cannot justify the difference in valuations between the U.S. stock market and those of other countries. Even after excluding the FAAMGs, U.S. stocks still trade at a significantly higher valuation than their non-U.S. peers. Investors are paying more for non-FAAMG U.S. company earnings than for non-U.S. company profits.
There’s Value in Value
Not only is there significant value to be garnered from rebalancing across countries, but also within them. As the graph below demonstrates, one of the most defining and prolonged trends in markets over the past several years has been the outperformance of growth over value stocks.
MSCI All Country Growth Index - MCSI All Country Value Index: Rolling 5-Year Returns
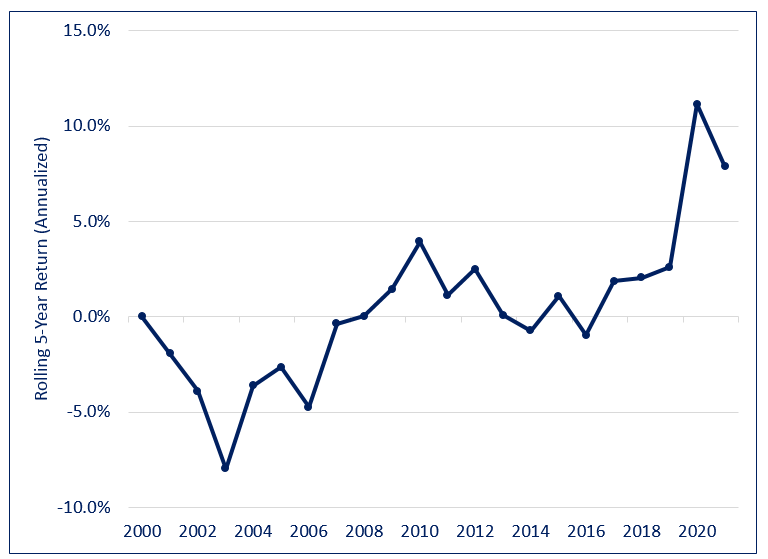
Importantly, the tremendous outperformance of growth vs. value has not been matched by a commensurate divergence in their respective fundamentals. At the end of last year, U.S. value stocks stood within the bottom 5% of all observations going back over 40 years in terms of their relative valuation to their growth counterparts. From a return perspective, a return to average relative valuations would necessitate value outperforming growth by a stunning 68%.
The Fed Put and Minsky Moments
Putting aside the preceding arguments for rebalancing portfolios both across and within countries, there is an increasingly prevalent mindset that risk assets are less risky than they have historically been.
Subscribers to this point of view did not arrive at this thesis out of nowhere, but rather have been conditioned. The initiatives taken by central banks to prop up economic activity and markets during the financial crisis of 2008 and during the pandemic are unprecedented in terms of their scope and veracity. These activities have led to an increasingly prevalent belief in what is referred to as the Fed put, whereby central banks will come galloping to the rescue of financial markets whenever they falter, making painful, long-term losses far less likely than history would suggest (if not impossible). By extension, this idea implies that risk assets such as equities are not that risky.
This type of thinking is representative of the very trap described by legendary economist Hyman Minsky. Minsky’s research focused on explaining the characteristics of financial crises. He proposed that markets are fundamentally unstable because stable environments (i.e., “good times”) sow the seeds of their own destruction (i.e., “tough times”) – that stability itself is destabilizing.
According to Minsky, when economic growth and rising asset prices have prevailed for an extended period, investors and creditors are lulled into a false sense of safety, which in turn causes them to engage in increasingly risky activities. Such behavior results in a narrowing of risk premiums which ultimately results in a “Minsky Moment” of panic and crisis.
Minsky’s theory holds that markets are most at risk when there is the least amount of fear among investors, and are least risky when, as Baron Rothschild stated, there is “blood in the streets”. Through a Minsky-esque lens, the increasingly popular belief that central banks can and will move to prevent any prolonged pain in financial markets should serve a cautionary signal.
Extracting Value, Taking the Cheap Seat, and Avoiding Train Wrecks
The encroaching leadership shift from growth to value equities favors our Canadian equity income mandate, which has delivered best in class results. Since its inception in October 2018, it has been in the top 1% of all funds according to the most recent S&P Index vs. Active Canada Scorecard, returning a cumulative 62.6%, as compared to 53.4% for the TSX Composite Index and 52.2% for the TSX Dividend Aristocrats Index. The fund has achieved this outperformance while exhibiting lower volatility and shallower losses during challenging environments.
The extreme undervaluation of emerging region stocks relative to their developed market peers presents a compelling case for having a significant allocation to EM equities over the long-term. Our emerging markets-focused Outcome Country Rotation strategy offers clients a value-added approach to investing in this asset class, outperforming the MSCI Emerging Markets by 15.1% since its inception in January 2021.
Lastly, there are some investors with cast-iron stomachs and very long-term horizons who are content to endure the severe losses that typically accompany Minsky moments (2000-2002, 2008). For those that do not fit this profile, the Outcome Global Tactical Asset Allocation (GTAA) mandate uses a data-driven, machine learning based approach to produce consistent returns while protecting clients from large losses, both during the challenging markets of Q4/2018 and the Covid crash of early 2020. These attributes are particularly valuable in challenging market environments, which we expect to be the case going forward (as opposed to the “easy money” environment that has prevailed since the global financial crisis of 2008