Contact Us
© All rights reserved. 2024
Subscribe to our monthly newsletter for the latest insights, commentary and strategy results.
Subscribe to Our NewsletterCompanies that pay sustainable dividends have provided the best returns over time, including during periods of elevated inflation.
Ned Davis Research (NDR) studied the relative performance of S&P 500 stocks according to dividend category from 1973-2020. Their findings are summarized in the following table:
Returns by Dividend Category (1973-2020)
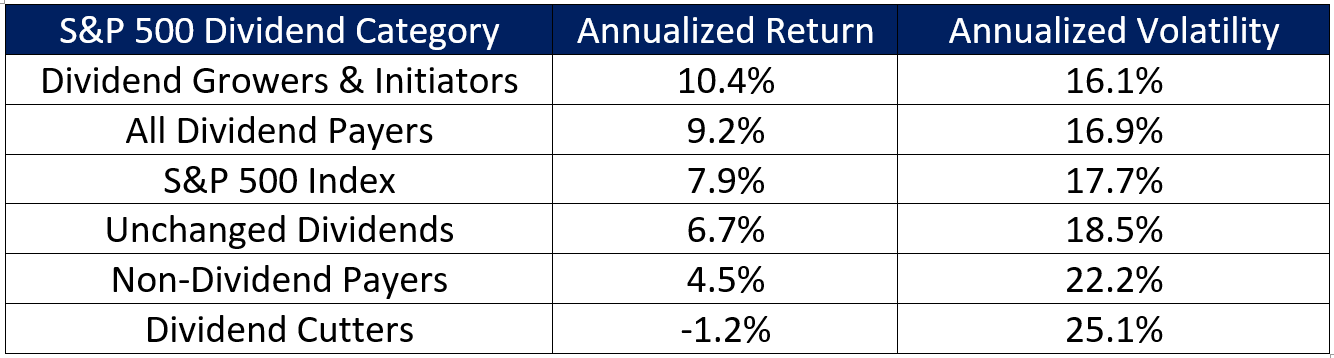
Over the past 48 years, dividend paying stocks have outperformed their non-dividend paying counterparts by 4.7% on an annualized basis. When coupled with the power of compounding, this difference is nothing short of astronomical. A $1 million investment in dividend payers over the period would have been valued at $68,341,836 as of the end of 2020, which is $60,070,380 higher than the value of only $8,271,456 for the same amount invested in non-dividend paying stocks.
Within the dividend paying complex, dividend growers and initiators have been the clear champions, with an annualized return of 10.4% vs. 9.2% for all dividend paying stocks. A $1 million investment in dividend growers and initiators would be valued at $115,482,326, which is $47,140,940 more than the same amount invested in all dividend payers.
Not only have dividend paying companies outperformed their non-dividend paying counterparts, but they have done so while exhibiting lower volatility.
NDR’s study also examined the relative performance of dividend payers vs. non-payers in various macroeconomic environments. Specifically, their research set out to ascertain how the outperformance of dividend vs. non-dividend paying stocks has been impacted by inflation, economic growth, and interest rates.
Inflation’s Impact on Returns by Dividend Category (1973-2020)
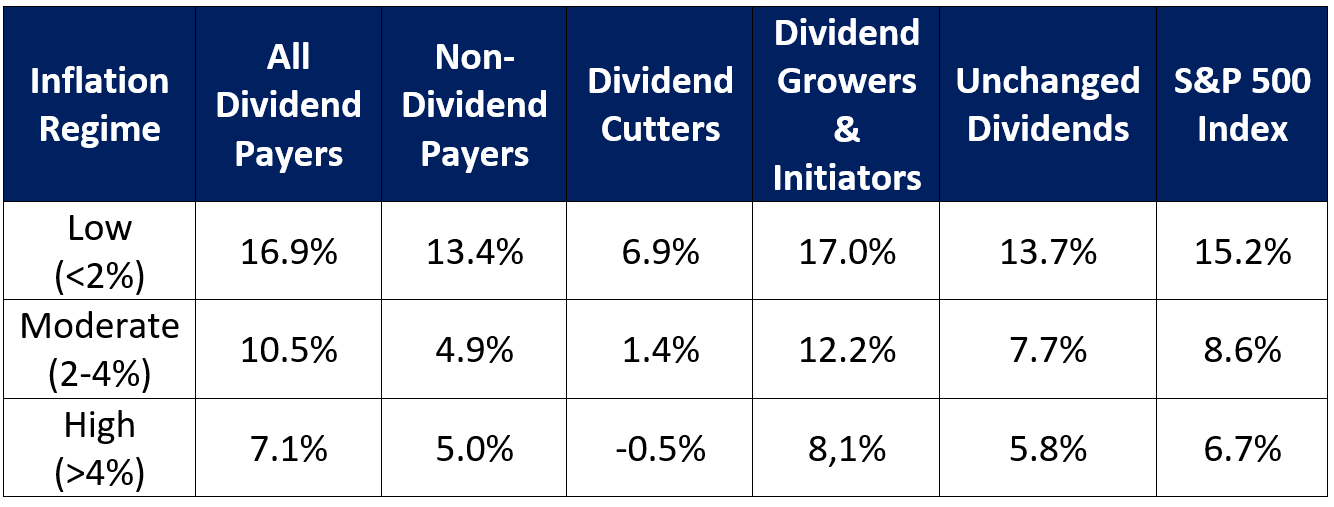
Dividend paying stocks have on average outperformed their non-dividend paying counterparts regardless of whether inflation has been low, moderate, or high.
Unsurprisingly, dividend growers and initiators outperformed other dividend paying companies during periods of moderate to high inflation.
The Economy’s Impact on Returns by Dividend Category (1973-2020)
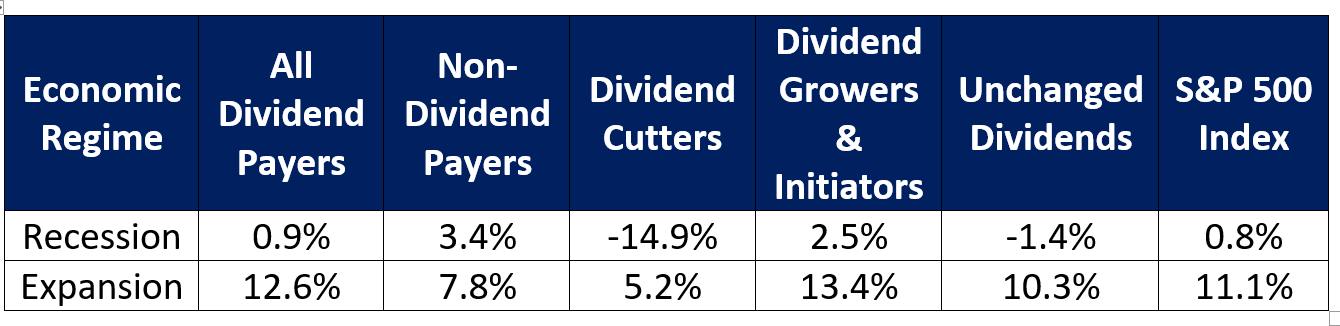
During recessions, dividend paying stocks have underperformed non-payers by 2.5% on an annualized basis. This shortfall pales in comparison to their 4.8% outperformance during economic expansions, especially considering that economies spend far more time expanding than contracting.
Once again, dividend growers and initiators have exhibited particularly strong performance, underperforming non-dividend payers by only 0.9% during recessions while outperforming them by 5.6% during expansions.
Interest Rates’ Impact on Returns by Dividend Category (1973-2020)
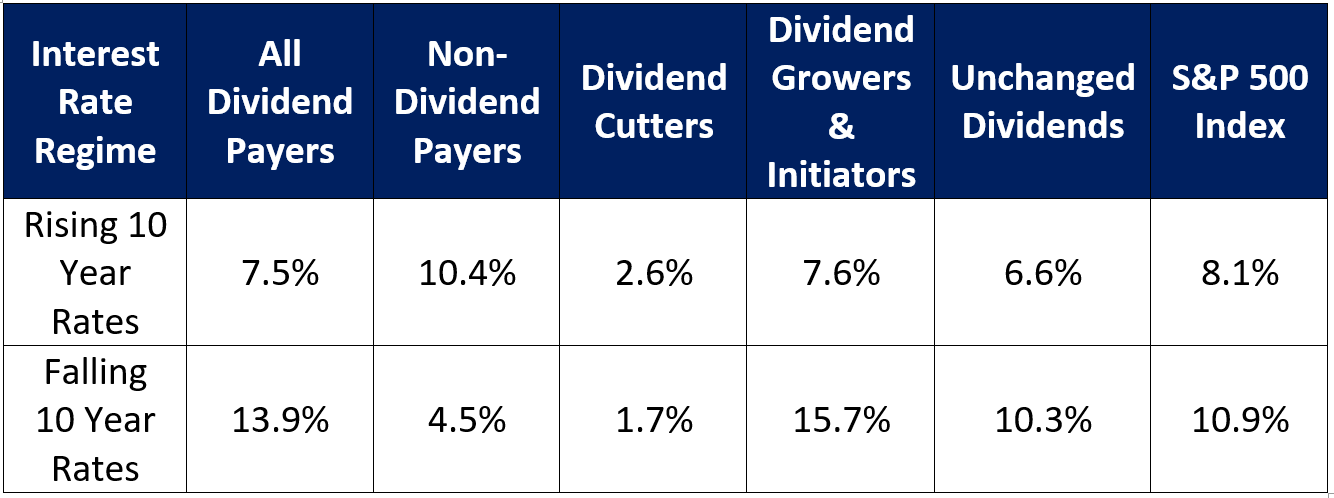
Whereas dividend payers underperformed non-payers by an annualized rate of 2.9% during periods when 10-year rates were rising, this shortfall pales in comparison to their blistering annual 9.4% rate of outperformance when rates were declining.
Once again dividend growers and initiators stood out. Whereas they barely outperformed all dividend payers during periods of rising rates, they did so by an annualized 1.8% when rates were falling.
Yield Support in Bad Times
The ability to consistently pay dividends suggests that a company is mature, has cash flow, and has cash on hand. These features enable dividend paying companies to have lower volatility and to hold up better than their non-dividend paying counterparts during market meltdowns.
This year investors are rediscovering the tendency for dividend paying stocks to better withstand hostile markets. On a year-to-date basis through the end of October, the S&P 500 Dividend Aristocrats Index has declined 8.7% in comparison to a 17.7% loss for the S&P 500 Index.
High quality dividend paying companies typically pay dividends regardless of share price movement. This source of return reduces losses in down markets. A company with a share price of $100 which pays $3 every year in dividends has a dividend yield of 3%. If a bear market materializes and stock price falls to $50 but the company maintains its annual payout of $3, then the stock’s dividend yield increases from 3% to 6%.
Assuming the company is financially stable, the new yield of 6% will provide what is referred to as “yield support”. The increased yield entices opportunistic bargain hunters to step in and buy the company’s stock, which slows, halts, or even reverses its downward trajectory.
There Is No Such Thing as A Free Lunch
"There is no such thing as a free lunch" is an adage which conveys the notion that it is impossible to get something for nothing. Notwithstanding their strong long-term performance, investors who are prone to FOMO (fear of missing out) be warned: there have and will be times when dividend payers underperform.
FOMO sufferers who were heavily invested in dividend payers would have watched in horror in 2007 as the S&P 500 Dividend Aristocrats Index underperformed the S&P 500 Index by 7.6% and the TSX Dividend Aristocrats Index underperformed the TSX Composite Index by 5.8%. They might have been similarly apoplectic in 2020-2021 as the liquidity-fueled surge in growth stocks caused U.S. and Canadian dividend payers to underperform their benchmarks by 15.5% and 9.1%, respectively. However, the fact remains that dividend paying stocks have produced meaningful outperformance over the long-term.
Good Idea, Poor Execution
Unfortunately, most dividend-focused managers have been unable to pass on the “magic” of dividend-paying stocks to investors. According to S&P Global, 79.3% of Canadian dividend-focused funds have underperformed the TSX Dividend Aristocrats Index over the past ten years ending June 30, 2022. The data over the past five years is even more daunting, with 88.1% of managers underperforming.
A Smoother Ride to a Better Destination
Our use of data, statistical analysis and machine learning has delivered strong results in a category where most managers have struggled to add value, enabling our clients to reap the power of Canadian dividend-growers.
Since its inception in October 2018, the Outcome Canadian equity income strategy has returned 45.6%, as compared to 36.9% for the TSX Composite Index and 33.7% for the TSX Dividend Aristocrats Index. Importantly, it has achieved this outperformance with lower volatility and shallower losses in challenging markets than either of the two benchmarks.
Coming Soon…
Given the outperformance of our Canadian Equity Income strategy, we adapted our approach to large-capitalization U.S. dividend-paying stocks.
Since going live at the beginning of April, our U.S. Equity Income strategy has joined its Canadian counterpart in producing strong outperformance. From its inception in April through the end of October, our U.S. portfolio has declined only 3.9% as compared to a loss of 13.7% for the S&P 500 Index.